

So, you read the last post and now know where to find your core dumps, great. Now what? That always seems to be the question, doesn’t it. What good is a core dump? The answer is “They can be really good, but you need tools.”
Emacs
No matter how much you hate it, no matter how much you think it is from the stone age, no matter how bloated you think it is, install GUI Emacs. Set it to an emulation mode you can tolerate and keep a cheat sheet of keyboard shortcuts. Even if you never use it to do actual software development, for GDB and core dumps its invaluable. (You can learn more about Emacs in my latest book covering Emacs.)
There are some gdb GUI front ends that look pretty and might even be tempting. Most of them don’t give you access to the gdb command prompt. When they can’t format your text or whatever data type you need to look at, you are screwed. You can find a way to view it if you are willing to dig and work from the command line.
Why not just gdb from the command line? When I’m working with an embedded system that doesn’t have much, sure. When you are working in a world that already has fire you don’t need to discover it on your own.
Launch the Debugger
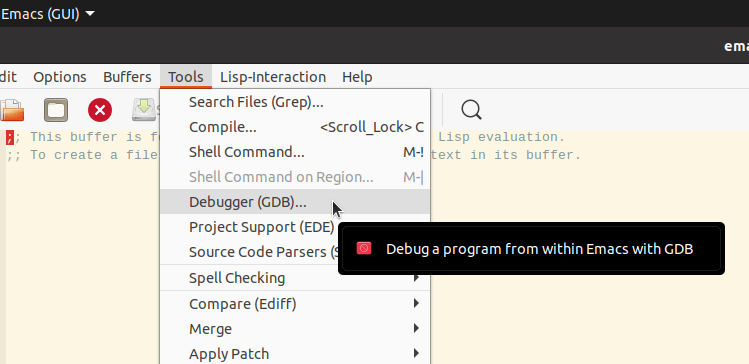
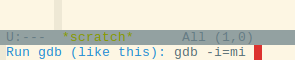
unless someone has really tweaked your Emacs configuration the prompt at the bottom of the screen should look like this.
You now need to tell it now only what program to load, but where that program is.
What? I want to look at a core dump!
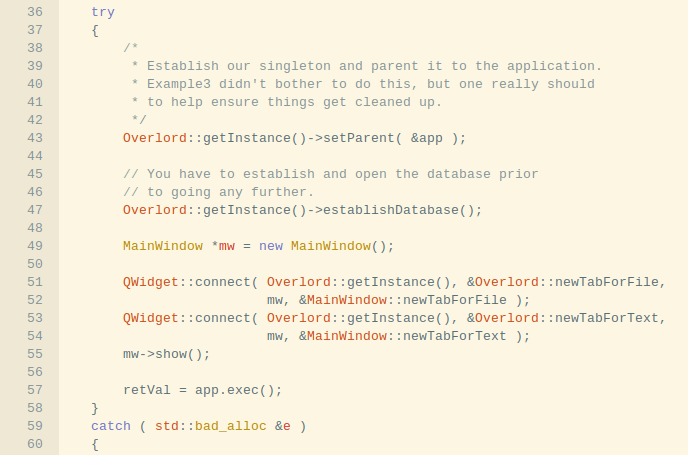
Yes you do and GDB needs to know what supposedly originated the dump. You also need to have as much as possible compiled and linked with debugging information at the point in time when the dump was created. First you tell it the program, next you tell it the core dump file.
Load Your Application
If you do much work from the Linux terminal command line you will be happy to know the TAB key can be used for completion here as well. Those of you who don’t know about it either learn to type or read up on it.

Yes that is a really long command line. Yes, you need to have the full path for everything. Those little bent arrows you see in the margin on each side is how Emacs indicates a wrap. After you hit return you should see something a bit more wonderful.

Yes, command line grunts are pointing out Emacs hasn’t done much for you. It actually has but that isn’t so obvious. More importantly it can and will because you will have a somewhat nice editor to look at code in . . . assuming you see a line much like this:
Reading symbols from /home/roland/sf_projects/copperspice_examples_install/Example6/example6…That means you had all of your paths correct and things matched up beautifully. It’s not quite as grand as a full GUI tool that could not only bring you up to exactly where you crashed with multiple beautifully formatted windows, but it will work.
LWP
I and many other professionals contend that Linux does not have processes. It has threads it calls processes and lighter weight threads it calls “threads.” It’s a deep geekly argument and you would have had to start out on real computers with real operating systems and taken an Assembly class for that platform. If you started out on x86 you are fighting an artillery war without any shells. Emacs agrees. LWP = Light Weight Process.
A Few commands to know
I’m not going through an exhaustive tutorial, I’m not qualified. Depending on what add-on packages your Emacs installation has, you may have commands only five people in the universe know about. I’m just going to try and point you in the correct direction.

You see, all of the cheesy GDB core dump examples online compile their own tiny little program with an obvious coding bug, generate a core dump, then say “Isn’t this great!” When they get the core dump file loaded for the executable the dump information takes them exactly to the line causing the problem and they have complete source for it.
You will notice that didn’t happen here.
I have the entire CsScintilla library compiled in debug as well as my application. We didn’t bounce right into the offending source. It wouldn’t even help if I had all of CopperSpice compiled with debug because the point of fatality is quite a ways away.

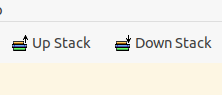
You can use the Up Stack button to navigate back in the call stack and the Down Stack button if you went too far back.
Some people will advise you to just jump straight to bt full.
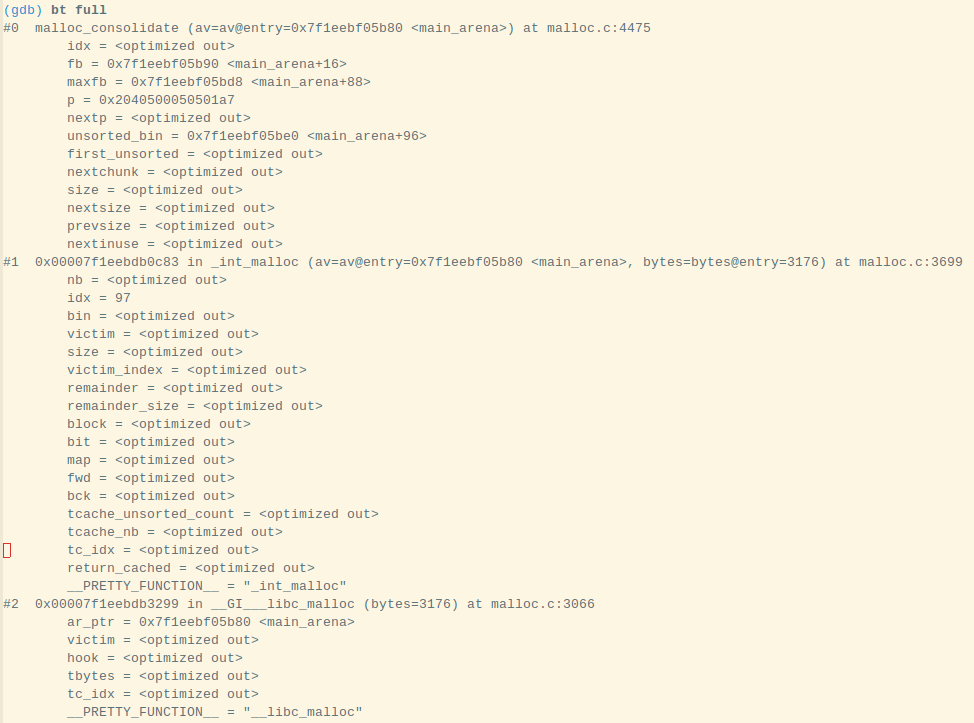
You will get many screens worth of stuff dumped. If you are really lucky you will find one of your source lines listed. Don’t think you are going to be lucky if you are using a large framework.

If that’s a bit too tiny for you to read, my bt full went all the way back to main.cpp line 57.
That’s why you always have to have your third party libraries built with debug. At least now you know which one(s) you need to build with debug information. After that, it is matter of walking back through the stack and examining local variables, perhaps dumping a memory location.
Threads

The previous was just looking at the thread that caused the core dump. It’s possible it got passed bad info from another thread. At any rate, you need to know how to view and navigate. Yes you can brute force this from the command line, but Emacs already provides a buffer.
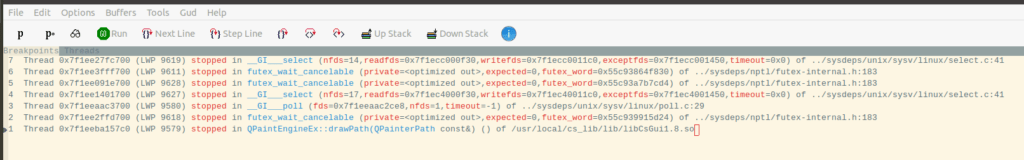
You need the “thread id” to switch between threads. Believe it or not, it is the little number on the far left, not the nice big hex number or the LWP.

Happy core dump analyzing!
Linux Mint 21.3 and others
You can’t use Emacs, at least you can’t unless you figure out how to get the file into a raw dump format. You might read the Emacs command line documentation and find a method of launching the debugger function so you can use it instead of raw terminal GDB, but here is how you use your dump file for now.
coredumpctl gdb 13362Again, that number at the end is the PID of the process that core dumped and I found it via
ls -al /var/lib/systemd/coredump
Eventually you get dumped to the GDB command line and if your executable was compiled with Debug information you can learn much. The GDB commands I covered in the Emacs portion of this will work for you here as well. Even without a Debug build you can learn a lot.

Yes, if you are working with core dumps, there is no way around learning GDB commands. You also really need to build everything in Debug.
coredumpctl -A --tui gdb 13362Can be used to start GDB using its Curses based Text User Interface. Most grizzled old hands won’t mess with something so fancy, but I’m not them.
You Have to Extract to Use Emacs
One can avoid the gdb tui or command line only interface by extracting. Just create a dumps directory under your HOME directory.
coredumpctl -o ~/dumps/reddiamond.coredump dump 13362After that you will have a coredump file Emacs can use located in your /home/user/dumps directory. If you want to skip looking up the PID,
coredumpctl -o ~/dumps/reddiamond.coredump dump /usr/bin/reddiamondThat command will create a new coredump file in your dumps directory for the last dump of the executable /usr/bin/reddiamond. Do not forget the dump command. It’s easy to miss if you have long paths. After that you can just use Emacs like earlier in this post.